Carolyn Liu

Currently a data analyst @ NYC Taxi & Limousine Commission.
I completed my MS in Computational Analysis & Public Policy @ UChicago in 2023 and my BA in Economics @ Wellesley College in 2018. I am passionate about using data science and machine learning in civic tech. In my previous life, I was an accounting and economics researcher at Harvard Business School.
Portfolio
Data Science
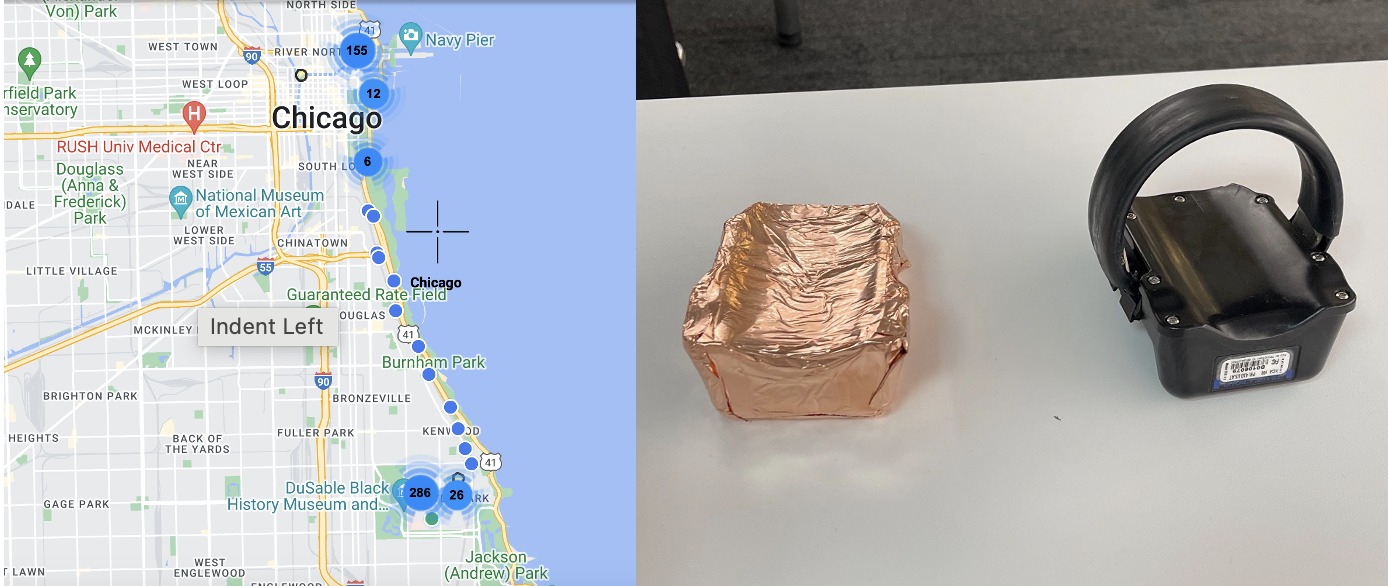
Data Science Clinic: Electronic Monitoring Device Shielding Detection
Project description: Electronic Monitoring can be an effective, safe, and humane means of decarceration if management software can appropriately identify serious infractions. Some participants are able to successfully shield their device signal and have been allegedly involved in criminal behavior while their signal was lost. Many other participants simply lose their signal due to
environmental factors such as living in a built-up environment, basement, or the like. At the moment, Cook County has no way to examine signal characteristics and check in with those that are most suspicious.
The team designed & conducted field tests to build sufficient ground-truth on device GPS signal loss and built logistic and XGBoost models in Python/Jupyter Notebook to identify whether device shielding was occurring (code available upon request).
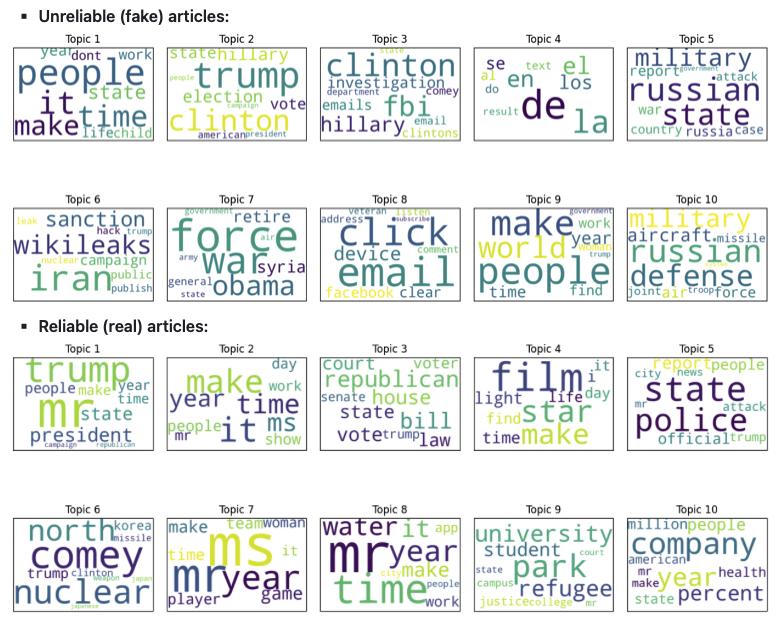
Fake News Detection
Project description: Final project for Large-Scale Computing for the Social Sciences (MACS30123). By developing accurate and effective methods to predict fake news, social scientists can: 1. understand how people consume information which can shed light on the psychological, social, and technological factors that contribute to the viral spread of misinformation; 2. assess the impact of fake news on society on the most vulnerable communities/individuals most susceptible of sharing misinformation without proper verification and develop interventions to mitigate the harmful effects; and finally, 3. understand the specifics of fake news that lead to manipulation of populations exposed and how to combat this phenomenon.
Why large-scale computing is important for this project: Text processing can benefit significantly from parallelization due to the computational expense of tasks like tokenization and feature extraction. Tokenization, which breaks text into smaller units, and n-gram extraction, which can create high-dimensional dataframes, require substantial memory resources. Large language models, while not used in this project, have millions of parameters and need significant computational power for tasks like text summarization. Model fine-tuning, such as hyperparameter tuning via grid search, is also computationally expensive and time-consuming.
Research Questions:
- Can fake news be predicted and if so, how well?
- What are the biggest differences between reliable and unreliable articles, and are there topics that are more susceptible to being faked?
Coding it Forward Civic Digital Fellowship
Project description: Civic Digital Fellow (summer 2022) at the U.S. Census Bureau’s Economic Indicators Division. The goal of the project was to enhance the usefulness of Business Formation Statistics (BFS), one of the Census Bureau’s newest data products that provides insight into early-stage business development.
I conducted exploratory record linkage and analysis in Python between BFS and various demographic datasets (Annual Business Survey & Nonemployer Statistics by Demographics) to develop a process (matching by unique identifier; resolving duplicates to select primary record) for an improved data product. Presented findings to external audiences and senior internal leadership on the process for assembling a more equitable & improved data product to help businesses, policymakers, regional planners, and researchers assess the current state of early entrepreneurship at the national and state levels.
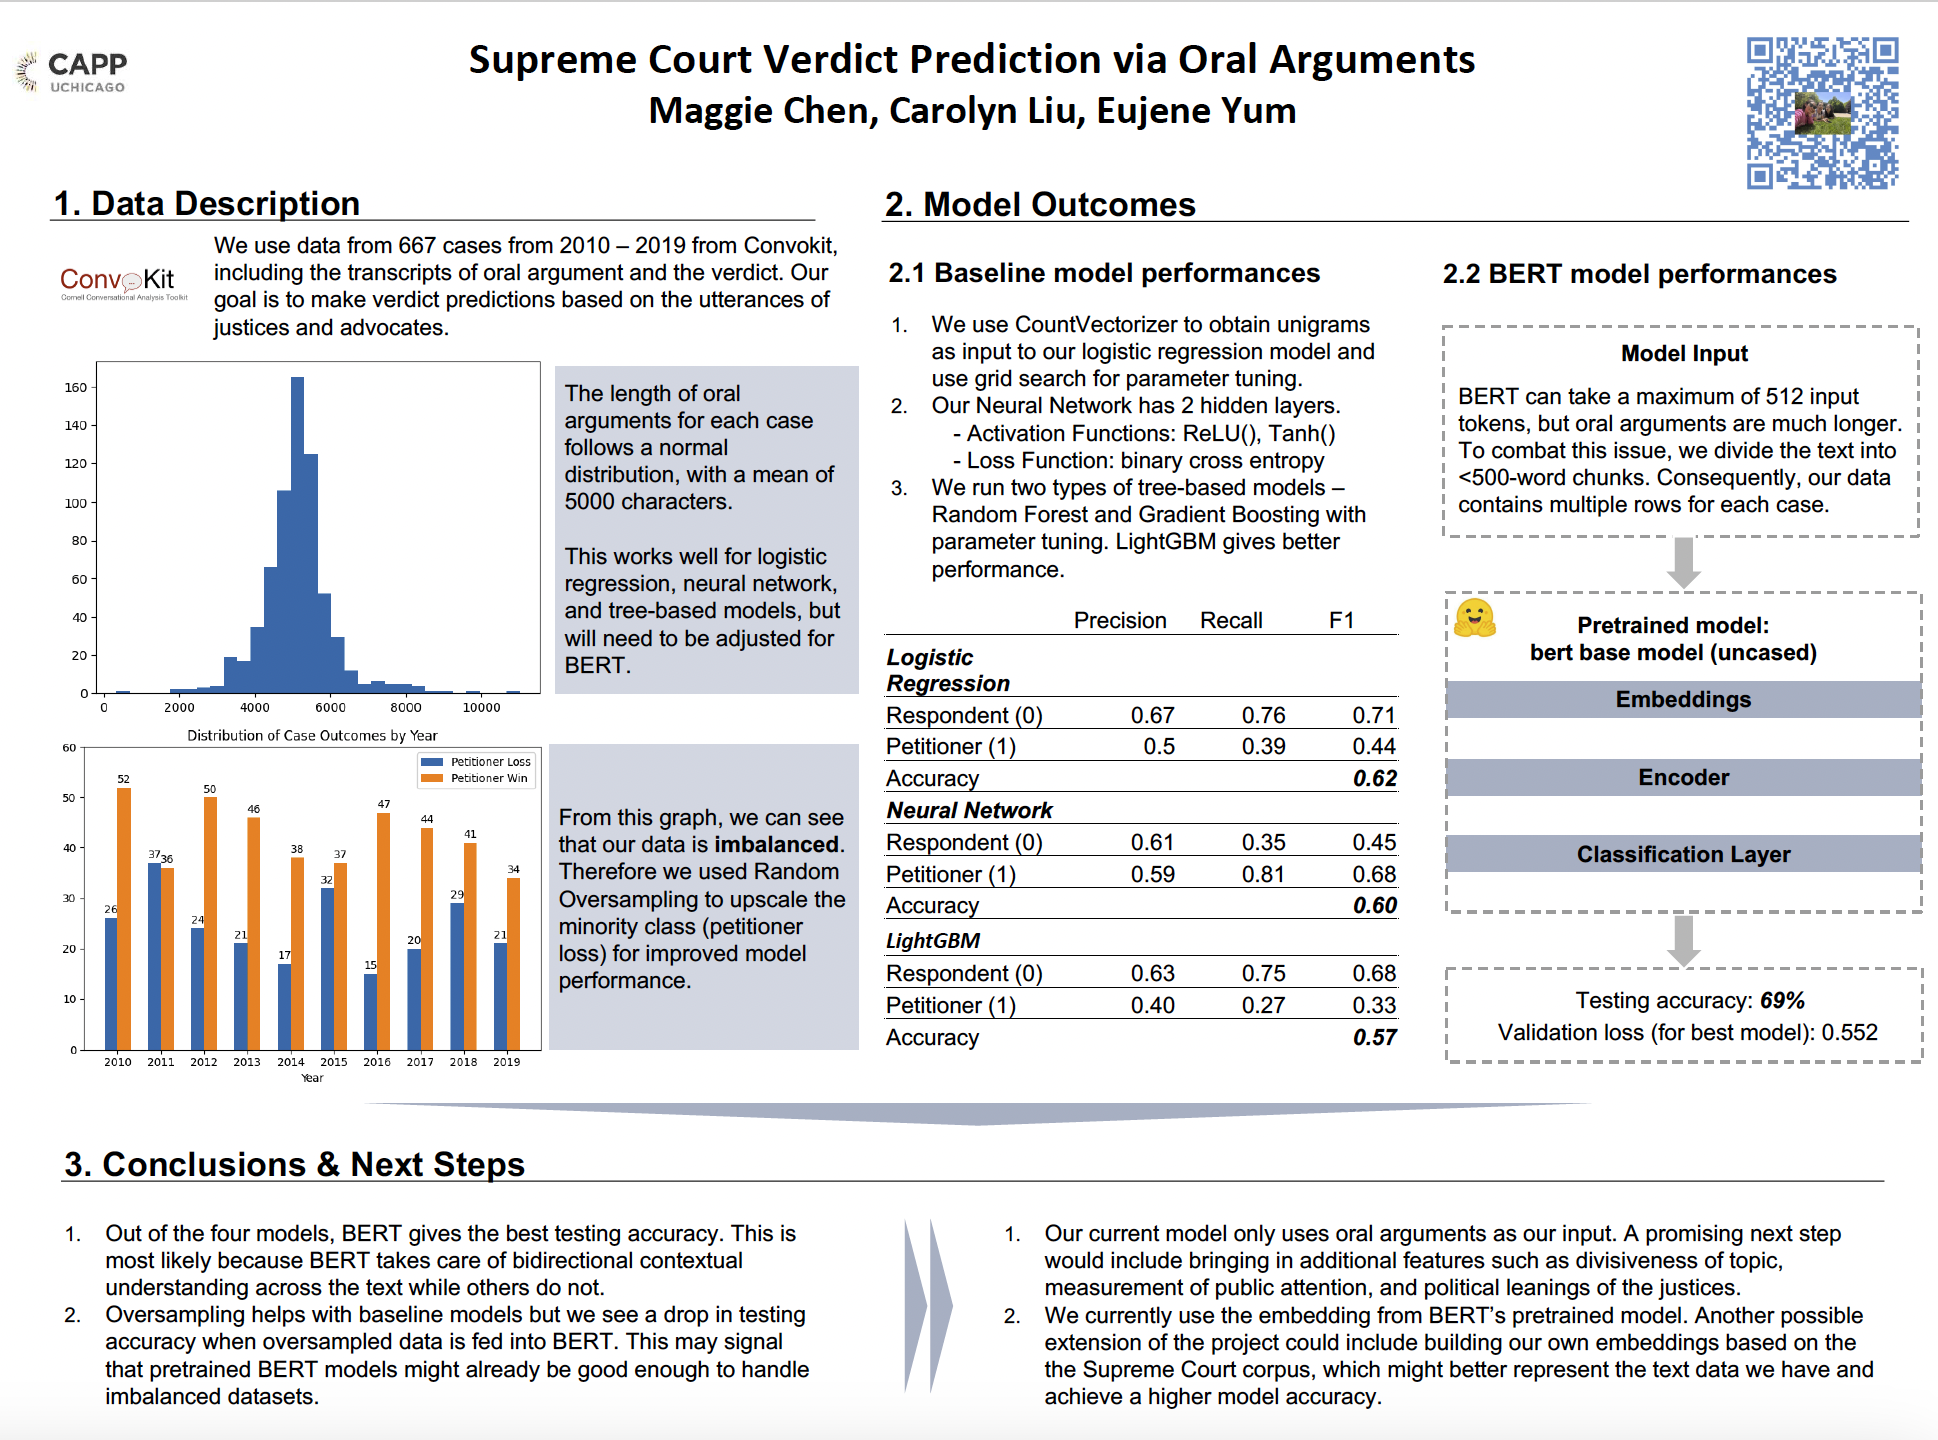
Supreme Court Verdict Prediction
Project description: Final group project for Advanced Machine Learning for Public Policy (CAPP30255). As the highest court in the land, the Supreme Court hears cases that impact the country’s social, political and economic future. The outcomes of these decisions trickle down and impact our day to day lives as well. In this project, we aimed to predict the outcome of Supreme Court hearings solely using oral arguments of judges and advocates. We processed a total of 667 cases from 2010 - 2019. We fine-tuned and deployed a total of 4 models which include logistic regression, simple neural network, multiple tree-based models, and BERT. Through many iterations of model input and loss functions, we found that the BERT model provided us with the highest accuracy of 69%.
Analyzing COVID Twitter Sentiments on Healthcare Stock Price Movements
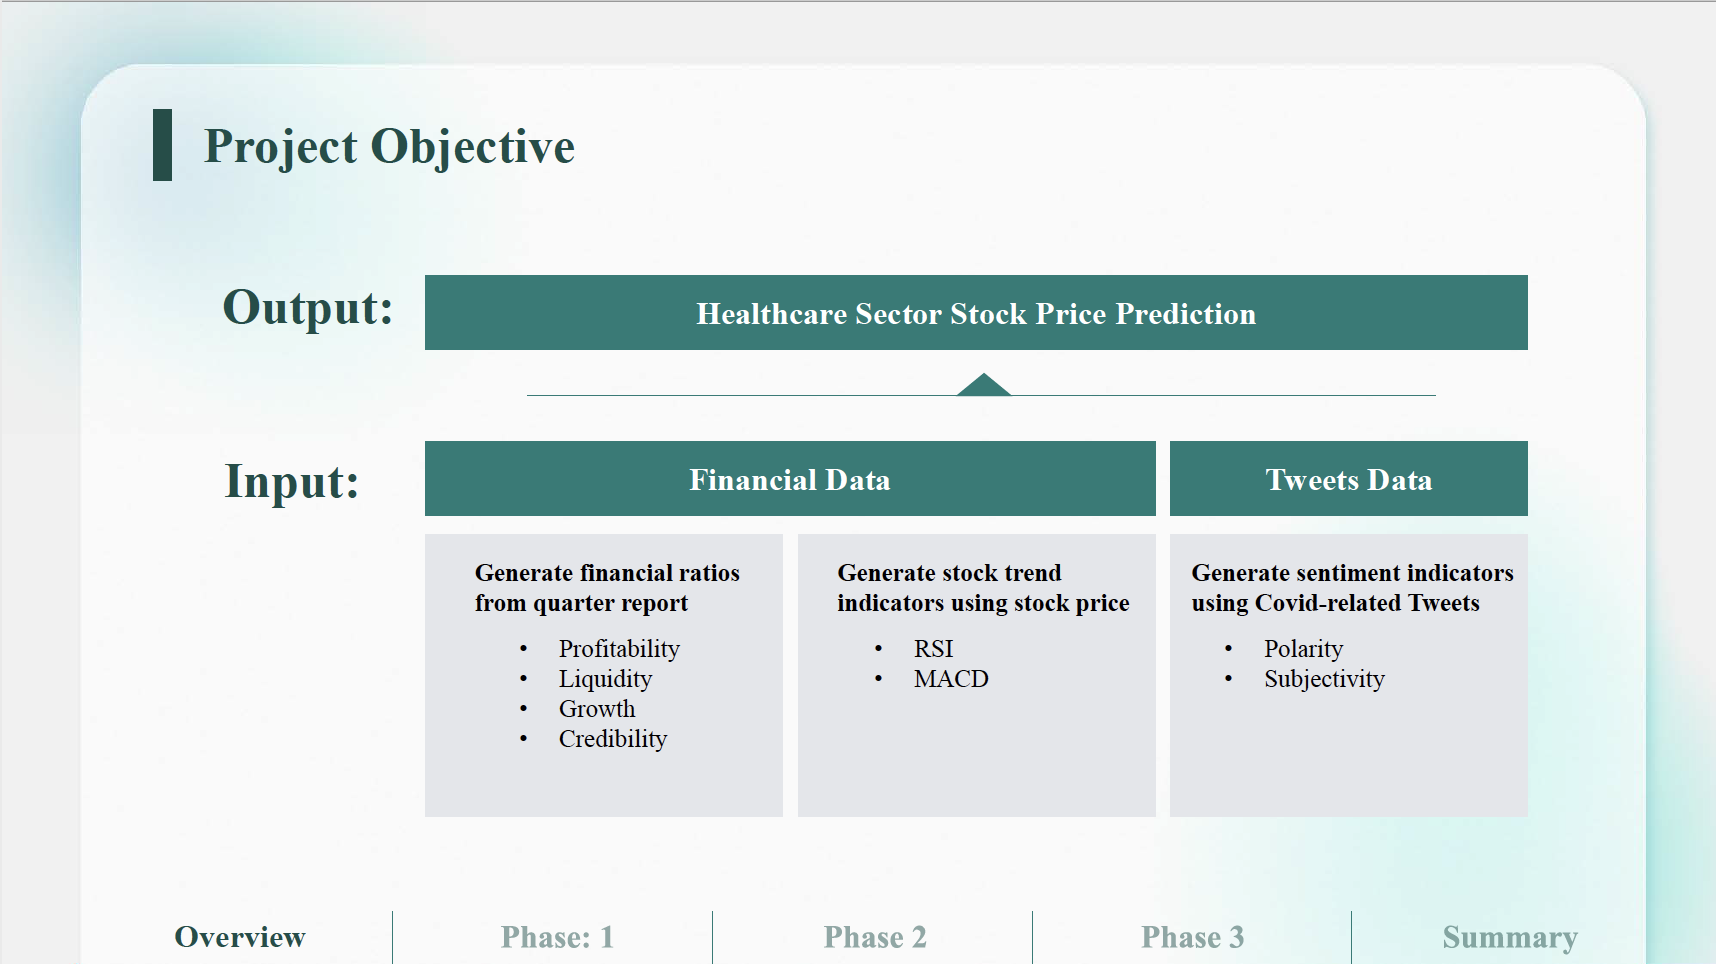
Project description: Final group project for Machine Learning for Public Policy (CAPP30254). The goal of this project is to predict healthcare sector stock prices. The target variables are stock price and the relative daily change of a stock. The features used come from financial data and COVID-related tweets. The entire project is divided into three phases, where each phase tries to solve problems that arose in the previous phase.
We conducted sentiment analysis on COVID-related Tweets to extract tweet polarity, preprocessed data & performed feature selection using information gain criteria. We developed logistic regression, random forest, gradient descent & support vector classification models to predict stock price direction based on time series data for multiple train-test datasets (9-month training; the following 6-months for testing).
Data Visualization
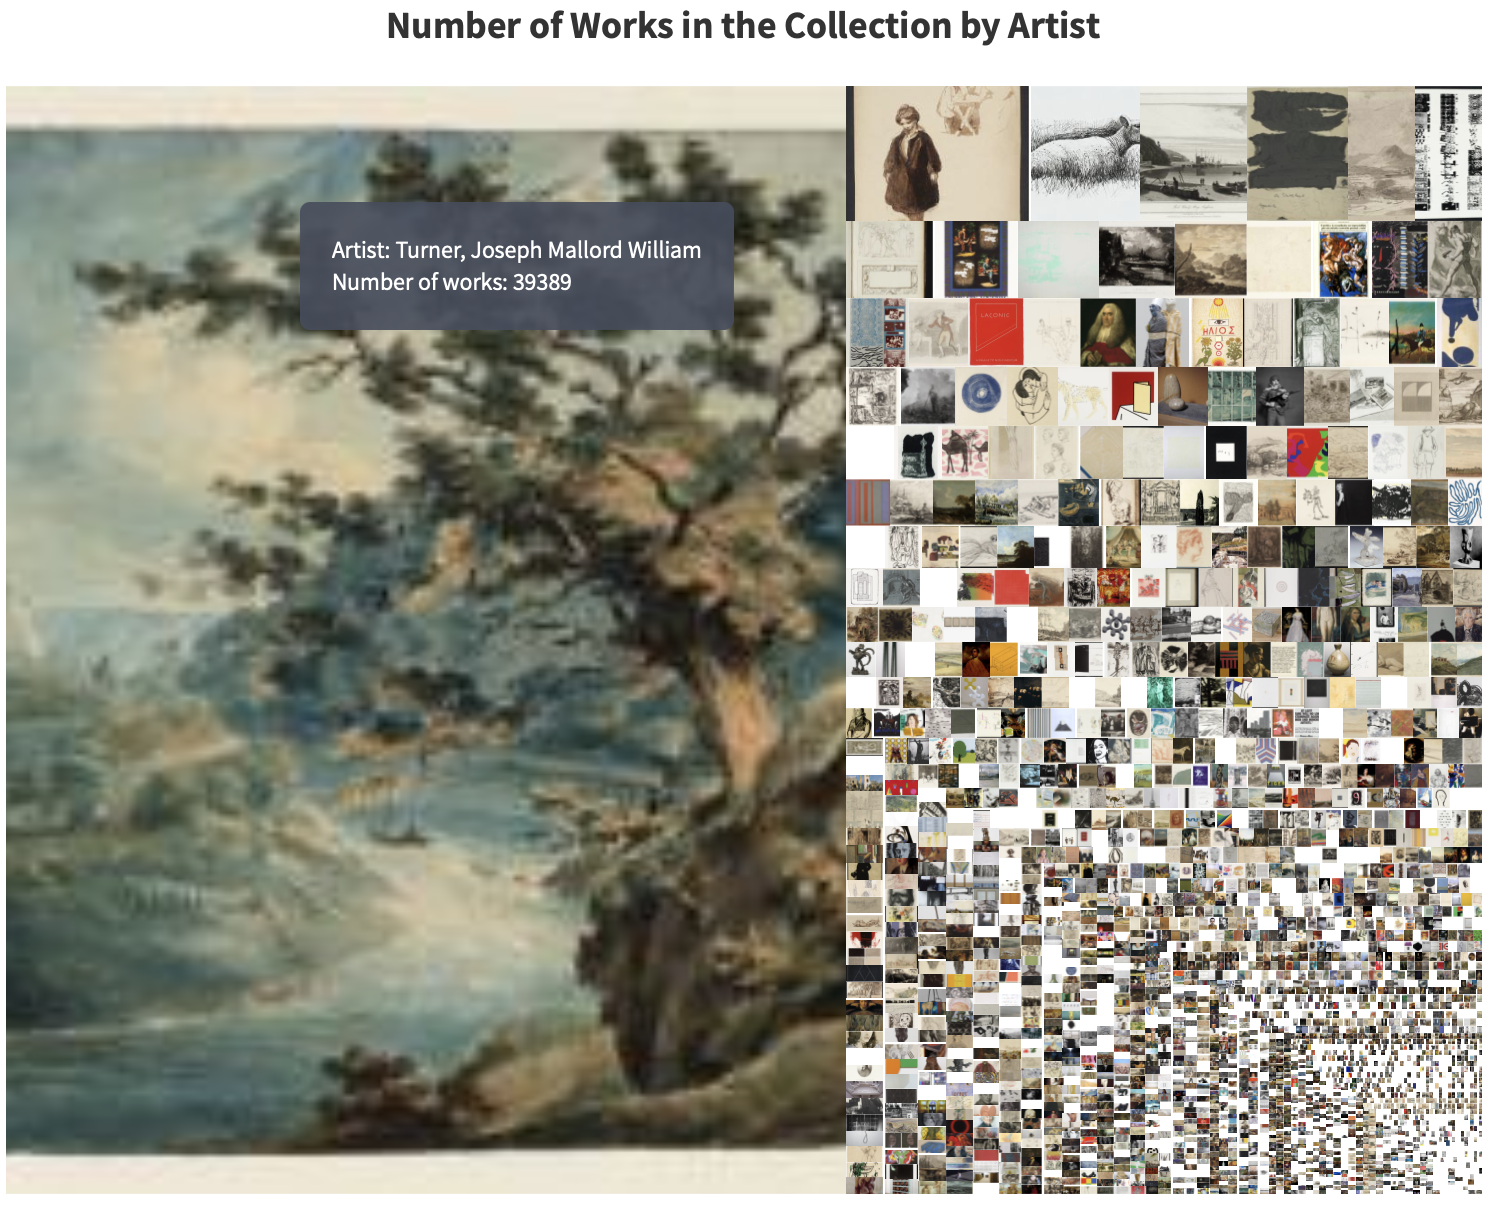
Final Project - The Tate Collection through the Years
Project description: Final Project for Data Visualization for Policy Analysis (CAPP30239). Coded primarily in D3.js to conduct visual storytelling (used stacked bar, interactive treemap & modified beeswarm charts) about the Tate Gallery Collection throughout time.
Python Application
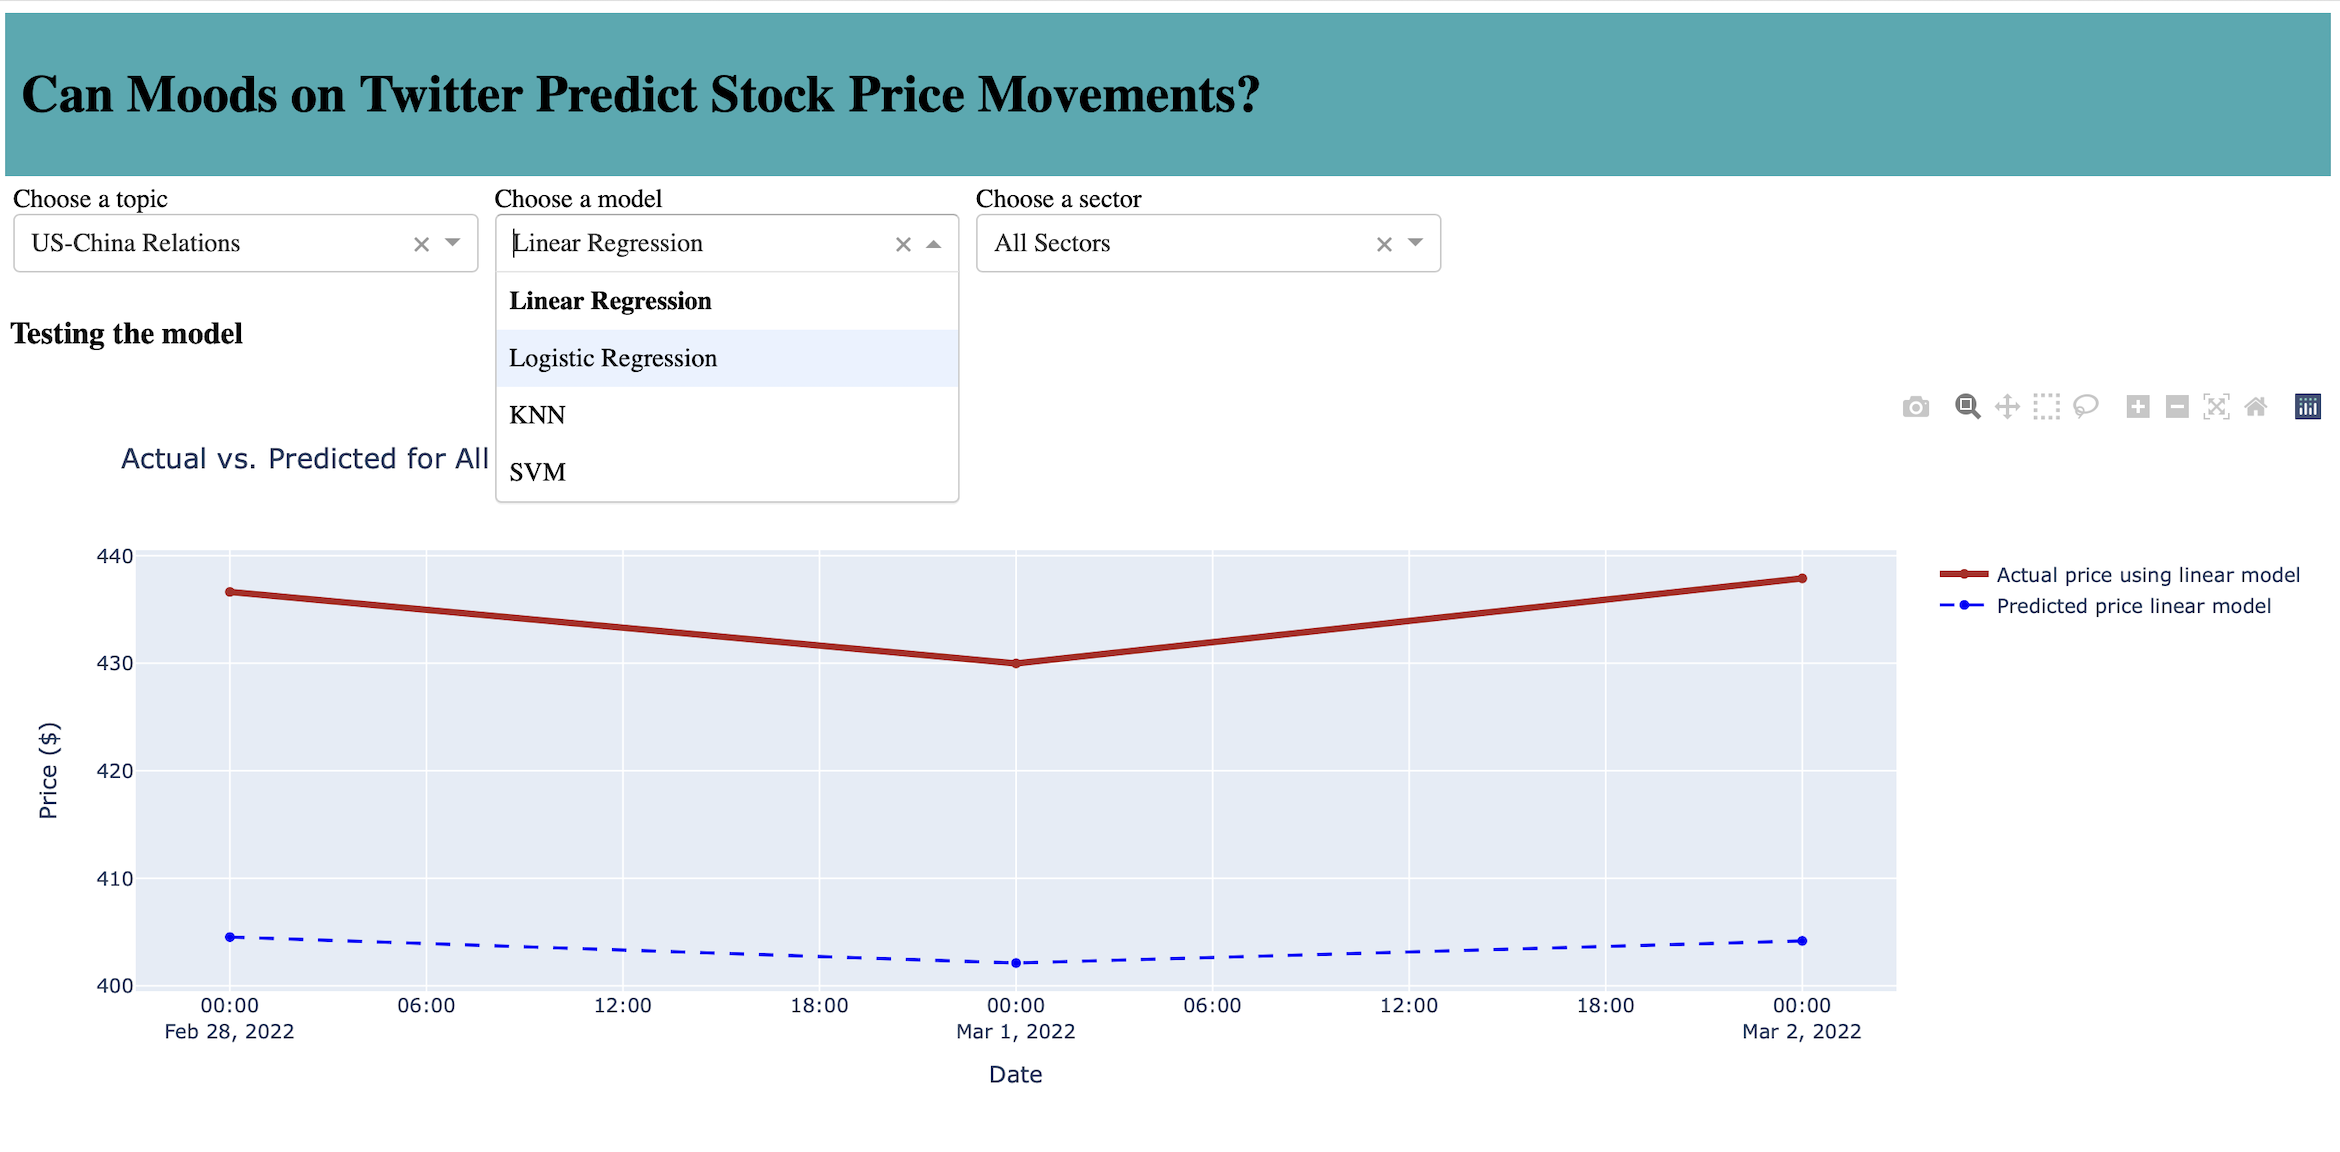
Stock Market Prediction using Twitter Sentiments
Project description: Final group project for Computer Science with Applications II (CAPP30122). Stock prices are influenced by the public attitude towards the market. Twitter is a popular place for users to express their moods and sentiments towards a
variety of topics. We used Python (pandas) to build basic models on how tweet polarity & sentiments are related to the daily movements of stock prices. Then coded with Python (Plotly Dash) to deploy an interactive dashboard for users to visualize the findings.
Page template forked from evanca